1. General
3.7 Years of Horse Racing Predictions – The IdealBet Historical Record
Published: 2026-09-25
3.7 Years of Horse Racing Predictions – The IdealBet Historical Record
A horse racing prediction can be judged after one race.
A prediction system is better understood by examining what happens across hundreds or thousands of races over time.
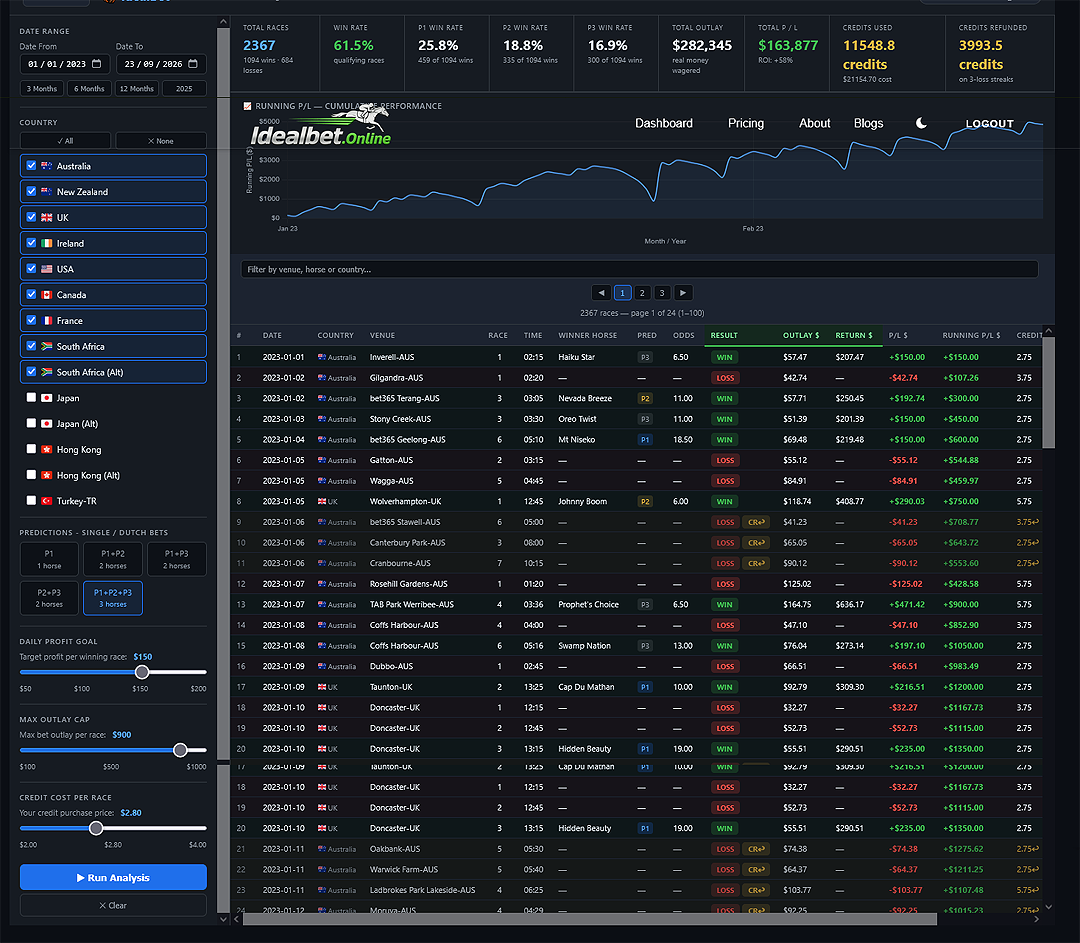
IdealBet's Historical Performance Grid brings together 3.7 years of qualifying horse racing predictions into a continuous historical record.
It includes the successful predictions.
It also includes the unsuccessful ones.
Why the Length of the Record Matters
A short run of results can look very different from long-term performance.
Racing naturally produces winning sequences, losing sequences, short-priced winners, longer-priced winners and periods where results vary considerably.
The longer the historical record, the more of that variation becomes visible.
That is why IdealBet does not restrict its historical evidence to recent winners or a small collection of selected races.
Each Race Adds Another Piece of Evidence
The historical record is built one qualifying race at a time.
For each race, the Grid can show information including the date, country, venue, race, predicted contender, odds, result, outlay, return and resulting profit or loss.
Those individual races then combine to form the larger historical record.
The Predictions Are Produced by Algorithms
IdealBet uses racing data and mathematical algorithms to identify qualifying contenders before the race.
Depending on the analysis, a race may produce one, two or three predicted contenders.
These are recorded as P1, P2 and P3.
After the race has been run, the actual result determines whether the prediction was successful.
The historical record therefore provides a way to examine how those algorithmic selections performed over time.
Winners and Losers Stay in the Record
A long historical record has little value if unsuccessful predictions can simply disappear from it.
IdealBet retains both WIN and LOSS results.
This matters because losing races affect strike rate, total outlay and cumulative profit or loss just as winning races do.
Removing either side would change the historical picture.
Real Odds Put the Results Into Context
Knowing that a predicted horse won is only part of the information required to examine a betting result.
The odds matter because they affect the relationship between the amount outlaid and the potential return.
This becomes particularly important when multiple predicted contenders are combined using Dutch Betting calculations.
By retaining the associated odds and financial figures, the historical record provides more context than a simple list of winning horse names.
Running P/L Shows What Happened Over Time
Individual race results can move in either direction.
The Running P/L column allows those individual outcomes to be followed cumulatively through the historical record.
This makes it possible to examine not only where wins occurred, but how winning and losing races combined over the complete period.
Different Markets Can Be Examined
IdealBet's historical racing data covers multiple countries and racing markets.
The Grid provides controls that allow the record to be investigated rather than presenting only one fixed summary figure.
This means the underlying races remain important. The headline statistics are summaries of the record — they are not substitutes for it.
Historical Results Do Not Guarantee the Next Result
Three-and-a-half-plus years of historical performance cannot tell anyone with certainty which horse will win the next race.
Horse racing always contains uncertainty.
What historical data can establish is what actually happened to previous predictions produced by the same selection process.
That distinction matters.
The historical record is evidence of past performance — not a promise about the next race.
Don't Just Look at the Headline Number
A strike rate or cumulative profit figure is useful, but it should not be the only thing examined.
Look underneath it.
Examine the races. Look at the dates. Check P1, P2 and P3. Look at the odds. Follow the WIN and LOSS results. Compare the outlays and returns. Follow the Running P/L.
The purpose of the Historical Performance Grid is to make that underlying record visible.
Then Test IdealBet in Real Time
Historical results show what happened previously.
There is another way to examine the process: see the predictions before the races run.
Get IdealBet predictions FREE for 7 days before the races run.
Record what was predicted, return after the races, and compare those predictions with the actual results.
You do not have to rely on a claim about what happened.
Judge the historical record. Then judge the predictions for yourself.
Real races · Real odds · Real proof · Real results.