1. General
How to Read the Historical Performance Grid
Published: 2026-09-23
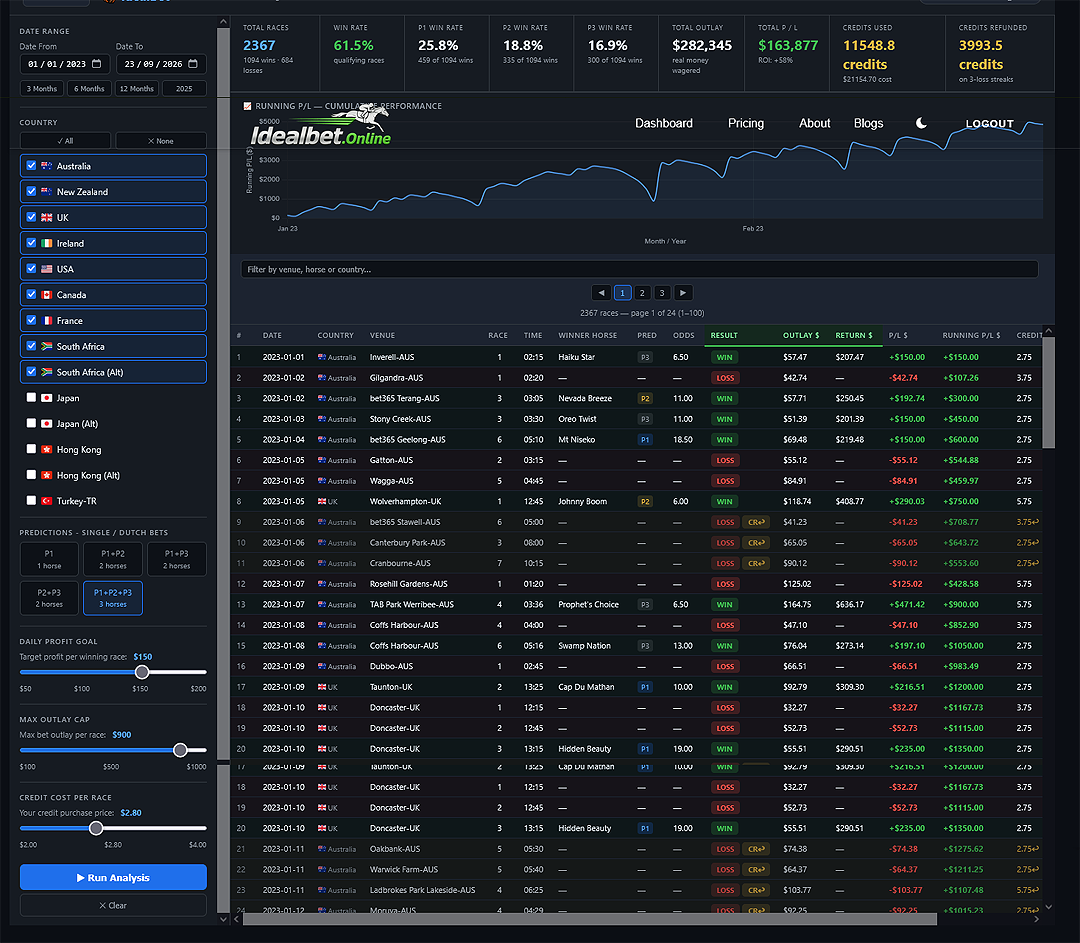
How to Read the Historical Performance Grid
If you're accustomed to a traditional betting app, the process is usually simple: choose a horse, enter an amount and place the bet.
The IdealBet Historical Performance Grid shows considerably more because it records not only individual race results, but how the IdealBet betting strategy operates across those races.
Once you understand the columns and one important rule, the Grid becomes much easier to read.
The key rule: IdealBet operates with a maximum of three betting races per day. Once the daily objective is achieved, betting stops for that day. The next session begins on the following day.
Start With One Row at a Time
Each row represents a qualifying race processed by the IdealBet system.
Reading from left to right, the Grid tells you what race was involved, whether an IdealBet prediction won or lost, the odds associated with a successful prediction, how much was outlaid, what was returned and the resulting profit or loss.
The important columns include:
- DATE — when the race occurred
- COUNTRY — where the race was held
- VENUE — the racecourse
- RACE — the race number
- TIME — race time
- WINNER HORSE — the successful IdealBet prediction when applicable
- PRED — whether the winner was the P1, P2 or P3 predicted contender
- ODDS — the recorded odds
- RESULT — WIN or LOSS
- OUTLAY $ — the amount required for that betting race
- RETURN $ — the return when the betting race wins
- P/L $ — profit or loss from that race
- RUNNING P/L $ — cumulative performance across the historical record
What P1, P2 and P3 Mean
IdealBet can identify up to three contenders in a qualifying race.
These are ranked as P1, P2 and P3.
Depending on the analysis, a betting race may involve a single predicted horse or a Dutch Betting combination involving two or three contenders.
The PRED column shows which predicted contender ultimately won when an IdealBet selection was successful.
WIN and LOSS Are Betting-Race Results
A green WIN means one of the IdealBet predicted selections won that betting race.
A red LOSS means the IdealBet selections did not produce the winner.
Both remain in the historical record.
Every winner. Every loser. Nothing removed.
The Most Important Concept — Maximum Three Betting Races
This is where the IdealBet approach differs substantially from simply opening a betting app and continuously betting race after race.
The objective is not to bet every race available throughout the day.
IdealBet works within a defined daily session containing a maximum of three betting races.
If the daily objective is achieved on the first betting race, the session stops.
If it is achieved on the second betting race, the session stops.
If necessary, the strategy can proceed to the third betting race.
Bet 1 — target achieved? STOP.
Bet 2 — target achieved? STOP.
Bet 3 — session ends. STOP.
There is no fourth betting race simply because more racing is available.
Then Wait for the Next Day
This stopping rule is an important part of understanding the Grid.
Once that day's IdealBet session has finished, the strategy does not continue searching for more bets simply for the sake of having another wager.
The session is finished.
Stop. Bank the result. Wait for the next day's qualifying races.
Why Some Losing Rows Appear Together
When reading the historical Grid, you may see several losses grouped on the same date.
Those should not automatically be interpreted as somebody continuously betting throughout the day.
They represent the sequence of qualifying betting races within that day's strategy.
The daily session is governed by the three-race limit and the stopping rule.
OUTLAY, RETURN and P/L
These three columns show the financial mathematics behind each betting race.
OUTLAY shows how much was required for the calculated bet.
RETURN shows what was returned when the betting race succeeded.
P/L shows the resulting profit or loss from that race.
This is particularly important with Dutch Betting because the total outlay may be distributed across two or three predicted horses rather than placed entirely on one selection.
RUNNING P/L Shows the Bigger Picture
An individual race tells you what happened once.
The RUNNING P/L column shows what happened as those individual results accumulated through the historical record.
This allows visitors to examine winning races, losing races, losing sequences and subsequent recoveries rather than judging the strategy from an isolated result.
Use the Sidebar to Investigate the Data
The controls beside the Grid allow you to change the way the historical data is analysed.
You can examine different date periods, countries, prediction combinations and daily profit settings.
Instead of accepting one headline figure, you can investigate different sections of the historical record yourself.
Don't Just Study History — Watch It Happen
The Historical Performance Grid shows what has already happened.
IdealBet also allows you to see predictions before the races are run.
Get IdealBet predictions FREE for 7 days before the races run.
See the predictions first. Then return after the races and compare them with the actual results.
That makes the process much easier to understand:
Prediction → Bet Calculation → Race → Result → Historical Grid.
The Grid Is the Evidence Trail
You do not need to understand every number on the screen immediately.
Start with the date. Follow the betting races. Look at P1, P2 and P3. Check WIN or LOSS. Then follow OUTLAY, RETURN, P/L and RUNNING P/L.
Most importantly, remember how the daily strategy operates:
Maximum three betting races. Hit the daily objective and stop. Otherwise stop after race three. Then wait for the next day.
Real races. Real odds. Real proof. Real results.